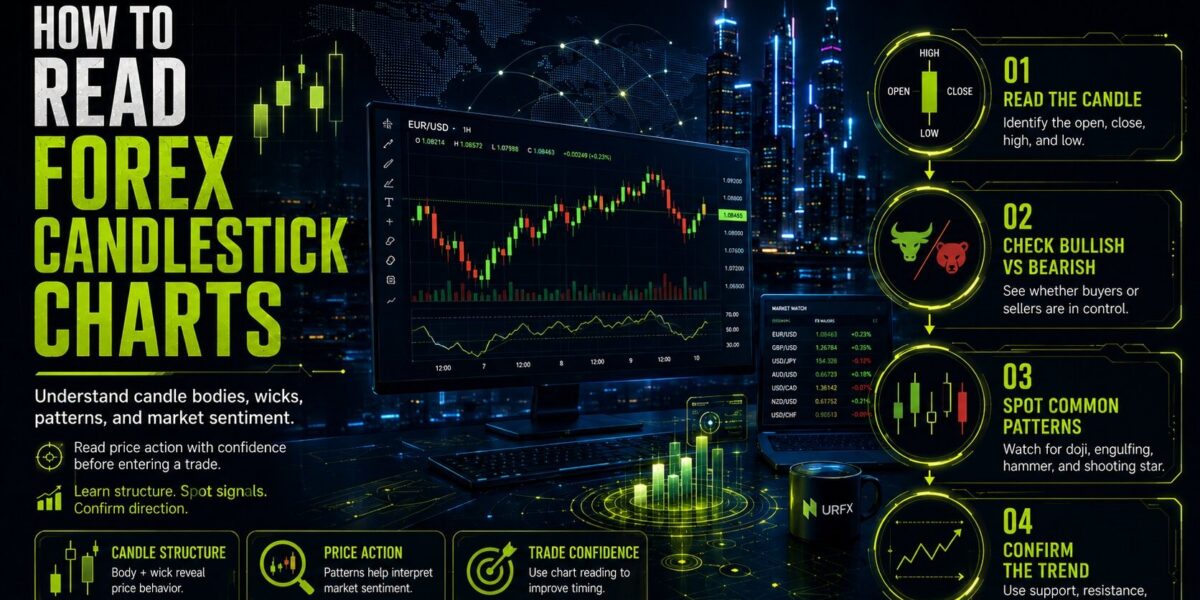
Candlestick charts represent one of the most powerful tools in technical analysis, providing traders with a visual representation of price movements and market sentiment that reveals the psychological battle between buyers and sellers. Originally developed by Japanese rice traders and later popularized in Western financial markets by Steve Nison, Japanese candlesticks have become the standard charting method for forex traders, stock traders, commodity traders, and active traders worldwide.
Forex Candlestick Charts allow traders to quickly evaluate opening prices, closing prices, market highs, market lows, buying pressure, and selling pressure within a specific trading period. By studying Forex Candlestick Charts, traders can identify trend reversals, continuation signals, market indecision, and changes in momentum before making informed trading decisions.
This comprehensive guide explains how to read and interpret Forex Candlestick Charts, recognize critical candlestick patterns, and apply this knowledge to improve trading accuracy and market timing. Whether you are preparing for an Instant Funding Proprietary Trading Firm or an Instant Funding Prop Trading Firm, mastering candlestick charting is essential for long-term success. Understanding these charts can help you avoid common forex trading mistakes, develop stronger risk-to-reward ratio strategies, control emotions during trading, and make more disciplined decisions under changing market conditions.
Understanding the Anatomy of Candlestick Charts
Every candlestick tells a detailed story about the price action that occurred during a specific trading period. Forex Candlestick Charts visually display the ongoing battle between buyers and sellers through candle bodies, upper wicks, and lower wicks. By learning how to interpret Forex Candlestick Charts, traders can identify buying pressure, selling pressure, market indecision, momentum shifts, and potential trend reversals. Understanding the story present
ed by Forex Candlestick Charts is fundamental to technical analysis and helps traders make more informed, disciplined, and confident trading decisions.
The Four Essential Components: OHLC Data : Forex Candlestick Charts
Each candlestick is constructed from open-high-low-close data, commonly known as OHLC data, which represents the four most important prices recorded during a specific trading period. In Forex Candlestick Charts, the opening price shows where the period began, the high price marks the highest level reached, the low price identifies the lowest level traded, and the closing price shows where the period ended.
These four data points create the complete visual structure of the candle and make Forex Candlestick Charts easy to interpret at a glance. The real body, also called the candle body, is the rectangular section extending from the opening price to the closing price. The upper shadow, often called the candlestick wick, stretches from the top of the real body to the high price, while the lower shadow extends from the bottom of the real body to the low price.
By studying these elements on Forex Candlestick Charts, traders can quickly determine whether buying pressure or selling pressure dominated the period. The size of the body and the length of the shadows can also reveal volatility, market rejection, momentum strength, and possible shifts in trader sentiment.
Bullish vs Bearish Candlesticks
A bullish candle, typically displayed as a green candlestick, forms when the closing price is higher than the opening price. On Forex Candlestick Charts, this indicates that buyers gained control during the trading period and pushed the market upward. The real body of a bullish candle is usually green, while the upper and lower shadows reveal the highest and lowest prices reached during that period. A long bullish body often reflects strong buying momentum, whereas a shorter body may indicate weaker momentum or market uncertainty.
Conversely, a bearish candle, typically displayed as a red candlestick, forms when the closing price is lower than the opening price. In Forex Candlestick Charts, this shows that sellers gained control and pushed prices downward during the period. The real body of a bearish candle is usually red, while its shadows show how far buyers and sellers moved the price before the candle closed.
By comparing bullish and bearish candles across Forex Candlestick Charts, traders can evaluate buying pressure, selling pressure, momentum strength, price rejection, and potential changes in market direction. However, the size of a candle’s shadows can vary, so traders should analyse the complete candle structure rather than assuming bullish candles always have small upper shadows or bearish candles always have small lower shadows.
Body Size and Wick Length: Reading Market Intensity
The size of the candle body and the length of the candlestick wick communicate important information about market sentiment and trader psychology. On Forex Candlestick Charts, a long-bodied candle usually indicates strong conviction in the market. A long green candle reflects strong bullish momentum and sustained buying pressure, while a long red candle signals strong bearish momentum and continued selling pressure.
A short-bodied candle on Forex Candlestick Charts often represents market indecision, showing that buyers and sellers remained relatively balanced during the trading period. These candles may appear during consolidation, before a breakout, or when an existing trend begins to lose strength.
The upper shadow and lower shadow reveal rejected price movements. A long upper shadow indicates that the price moved higher but was pushed back down by sellers, creating resistance or profit-taking pressure. A long lower shadow shows that the price moved lower but was rejected by buyers, suggesting support and renewed buying interest. By analysing candle bodies and wick lengths across Forex Candlestick Charts, traders can better understand momentum, volatility, price rejection, and potential shifts in market direction.
Single Candlestick Patterns and Their Meanings
Individual candlesticks can reveal valuable information about market turning points, price rejection, and potential trend reversal opportunities. On Forex Candlestick Charts, specific candle shapes may show when buying or selling momentum is weakening and when control could shift between buyers and sellers.
By studying individual candles on Forex Candlestick Charts, traders can identify warning signs such as long wicks, small bodies, doji formations, hammers, and shooting stars. These formations may indicate indecision, exhaustion, or a possible change in market direction.
However, individual signals on Forex Candlestick Charts should not be used in isolation. Traders should confirm them with the existing trend, support and resistance levels, trading volume, momentum indicators, and the candles that follow before making a trading decision.
Doji: The Indecision Candle
A doji is a candlestick with little or virtually no real body, forming when the opening price and closing price are identical or extremely close. On Forex Candlestick Charts, the upper and lower shadows may vary in length, but the defining feature is the narrow body, which indicates that neither buyers nor sellers gained clear control during the trading period.
When a doji appears after an extended uptrend on Forex Candlestick Charts, it may signal that bullish momentum is weakening and that a potential bearish reversal could develop. Similarly, a doji forming after a sustained downtrend may suggest that selling pressure is fading and a possible bullish reversal is approaching. Its significance becomes stronger when it appears near important support or resistance levels.
However, a doji alone should not be treated as a reliable trading signal. Traders analysing Forex Candlestick Charts should wait for confirmation from subsequent candlesticks, price action, trading volume, momentum indicators, and the broader market trend before entering a position.
Hammer and Hanging Man: Reversal Signals
A hammer is a candlestick with a small real body at the top, a small or nonexistent upper shadow, and a long lower shadow that is at least twice the height of the real body. A hammer appearing at the bottom of a downtrend suggests potential bullish reversal as buyers rejected lower prices. The long lower shadow indicates that sellers pushed prices down, but buyers stepped in and pushed prices back up, creating buying momentum. A hanging man has the same visual structure as a hammer, but appears at the top of an uptrend and suggests potential bearish reversal as the bullish momentum weakens .
Shooting Star and Inverted Hammer: More Reversal Patterns
A shooting star is a candlestick with a small real body at the bottom, a small or nonexistent lower shadow, and a long upper shadow that is at least twice the height of the real body. A shooting star appearing at the top of an uptrend suggests potential bearish reversal as sellers rejected higher prices. The long upper shadow indicates that buyers pushed prices up, but sellers stepped in and pushed prices back down, creating selling pressure. An inverted hammer has the same visual structure but appears at the bottom of a downtrend and suggests potential bullish reversal .
Spinning Top and Marubozu: Additional Single Candle Patterns
A spinning top is a candlestick with a small real body and upper shadow and lower shadow of roughly equal length, indicating strong market indecision. A spinning top suggests that neither bulls and bears could gain control, and a trend reversal or trend continuation is uncertain. A marubozu is a candlestick with no upper shadow or lower shadow, where the opening price equals either the high price (for bullish candles) or the low price (for bearish candles). A marubozu indicates strong conviction and strong bullish momentum or bearish momentum throughout the entire trading period .
Multi-Candlestick Patterns: Recognizing Trend Changes
Multiple candlesticks together form patterns that provide stronger trading signals than individual candles.
Bullish Engulfing and Bullish Harami: Reversal Patterns
A bullish engulfing pattern consists of a bearish candle followed by a larger bullish candle that completely engulfs the previous candle’s real body. This pattern indicates potential price reversal from downtrend to uptrend as buyers gaining control overwhelms previous selling pressure. A bullish harami consists of a large bearish candle followed by a smaller bullish candle that is completely contained within the previous candle’s real body. A bullish harami cross is a variation where the second candle is a doji. These patterns suggest bullish reversal as the strong bearish candle is followed by weakening bullish momentum .
Bearish Engulfing and Bearish Harami: Downtrend Reversals
A bearish engulfing pattern consists of a bullish candle followed by a larger bearish candle that completely engulfs the previous candle’s real body. This pattern indicates potential price reversal from uptrend to downtrend as sellers gaining control overwhelms previous buying pressure. A bearish harami consists of a large bullish candle followed by a smaller bearish candle that is completely contained within the previous candle’s real body. These patterns suggest bearish reversal as the strong bullish candle is followed by weakening bullish momentum .
Three-Candle Patterns: Morning Star and Evening Star
A morning star pattern consists of three candlesticks: a strong bearish candle, a small-bodied candle (often a doji), and a strong bullish candle. This pattern indicates bullish reversal from downtrend to uptrend as buying momentum returns. An evening star pattern is the inverse: a strong bullish candle, a small-bodied candle, and a strong bearish candle, indicating bearish reversal from uptrend to downtrend. A rising three methods pattern consists of a strong bullish candle followed by three smaller bearish candles, then another strong bullish candle, indicating bullish continuation pattern within an uptrend. A falling three methods pattern is the inverse, indicating bearish continuation pattern within a downtrend .
Advanced Candlestick Patterns and Combinations
Experienced traders recognize more complex chart patterns that provide powerful trading signals.
Piercing Pattern and Dark Cloud Cover
A piercing pattern consists of a strong bearish candle followed by a bullish candle that opens below the previous candle’s closing price but closes above the midpoint of the previous candle’s real body. This pattern suggests bullish reversal as buyers show strength. A dark cloud cover is the inverse: a strong bullish candle followed by a bearish candle that opens above the previous candle’s closing price but closes below the midpoint of the previous candle’s real body. This pattern suggests bearish reversal as sellers show strength .
Three White Soldiers and Three Black Crows
A three white soldiers pattern consists of three consecutive strong bullish candles, each with a small upper shadow and each closing near its high price. This pattern indicates strong bullish momentum and uptrend continuation. A three black crows pattern is the inverse: three consecutive strong bearish candles, each with a small lower shadow and each closing near its low price. This pattern indicates strong bearish momentum and downtrend continuation .
Using Candlesticks with Support, Resistance, and Confirmation
Effective candlestick charting combines pattern recognition with other technical analysis tools.
Support Levels and Resistance Levels
Support levels are price areas where buying pressure has historically prevented further price movements downward. Resistance levels are price areas where selling pressure has historically prevented further price movements upward. Candlestick patterns gain significance when they occur at support and resistance zones. A bullish reversal pattern at a support level is more significant than the same pattern occurring in the middle of a downtrend. Similarly, a bearish reversal pattern at a resistance level is more significant than the same pattern occurring in the middle of an uptrend .
Confirmation Candle and False Signals
A confirmation candle is the candlestick that follows a candlestick pattern, providing evidence that the pattern is valid. For example, after a bullish engulfing pattern, a confirmation candle that closes above the pattern’s high price confirms the bullish reversal. Without a confirmation candle, many candlestick patterns produce false signals that lead to losing trades. This is why traders often combine candlestick charting with volume analysis and technical indicators like the average directional index to confirm trading signals .
Candlesticks in Different Timeframes and Markets
Candlestick charts are universal tools applicable across all financial markets and timeframes.
Forex Charts, Stock Charts, and Commodity Charts
Forex charts display candlestick patterns for currency pairs, stock charts display patterns for individual stocks, and commodity charts display patterns for commodities. The same candlestick patterns apply across all these markets because they reflect universal trader psychology and market sentiment. A bullish engulfing pattern in a forex chart has the same significance as a bullish engulfing pattern in a stock chart. However, different markets have different market volatility characteristics, so traders must adjust their risk to reward ratio and position sizing accordingly .
Comparing Candlesticks with Bar Charts and Line Charts
While candlestick charts are the most popular method for technical analysis, some traders prefer bar charts or line charts. Bar charts display the same OHLC data but use a different visual format. Line charts only display closing prices, omitting opening price, high price, and low price information. Candlestick charts are superior because they provide complete OHLC data in a visual format that immediately communicates price action and market sentiment. For traders preparing for demo trading vs live trading transitions or those using back test a forex trading strategies, candlestick charts provide the most complete historical price data .
Integrating Candlesticks into Your Trading Strategy
Mastering candlestick charting is essential for developing profitable trading strategies.
Pattern Recognition and Trend Identification
Successful traders develop pattern recognition skills that allow them to quickly identify candlestick patterns and chart patterns in real-time. Trend identification using candlesticks involves recognizing sequences of bullish candles (indicating uptrend) or bearish candles (indicating downtrend). Once you identify a trend, you can look for candlestick patterns that suggest trend continuation or trend reversal. This systematic approach to candlestick charting helps traders avoid common forex trading mistakes and develop consistent trading signals .
Combining with Fundamental Analysis and Volume Analysis
While candlestick charting is a powerful technical analysis tool, combining it with fundamental analysis and volume analysis produces superior results. A bullish reversal pattern at a support level becomes even more significant if volume analysis shows increasing buying pressure. Similarly, a bearish reversal pattern at a resistance level becomes more significant if fundamental analysis suggests weakening demand. This multi-faceted approach helps traders control emotions and maintain discipline during short-term price movements .
Avoiding False Signals and Improving Trading Discipline
Many traders make common forex trading mistakes by trading every candlestick pattern they see without proper confirmation candle validation. To improve your trading discipline, establish clear rules for which candlestick patterns you will trade and which you will ignore. Require confirmation candles before entering trades. Combine candlestick charting with technical indicators to filter out false signals. This disciplined approach, combined with proper risk to reward ratio management, will significantly improve your trading results .
Important Disclaimer: This guide is provided for educational purposes only and does not constitute financial or investment advice. Past performance is not indicative of future results. Trading forex and other financial instruments involves substantial risk, and you should only trade with capital you can afford to lose. Always consult with a qualified financial advisor before making trading decisions.