In the vast landscape of financial markets, technical analysis serves as a guiding map for navigating volatile price movements. Among the most revered tools in this discipline is candlestick analysis, which allows traders to interpret the underlying market psychology and anticipate shifts in trend direction. For generations, stock chart patterns and trading patterns have been utilized to decode the ongoing battle between buyers and sellers. When a market undergoes an extended price decline, identifying a reliable bullish reversal pattern becomes paramount for securing a profitable entry. A Three Candle Strategy can help traders recognize early reversal clues with more confidence. The Three Candle Strategy is especially useful when buyers begin gaining strength after prolonged selling pressure. By applying the Three Candle Strategy with confirmation signals, traders can better time entries and manage risk effectively.
Among the various multi-candlestick formations, the morning star pattern stands out as one of the most reliable and visually distinct indicators of a potential recovery. This classic three-candle pattern serves as a powerful reversal signal, marking a structural market transition from bearish dominance to bullish interest. The Three Candle Strategy helps traders understand how selling pressure weakens, indecision forms, and buyers regain control. In this article, we will dissect the Three Candle Strategy, explore the anatomy of each candle, examine the behavioral psychology behind the formation, and discuss how to integrate the Three Candle Strategy into a robust risk management framework for smarter trading decisions.
1. Anatomy of the Morning Star Candlestick Formation
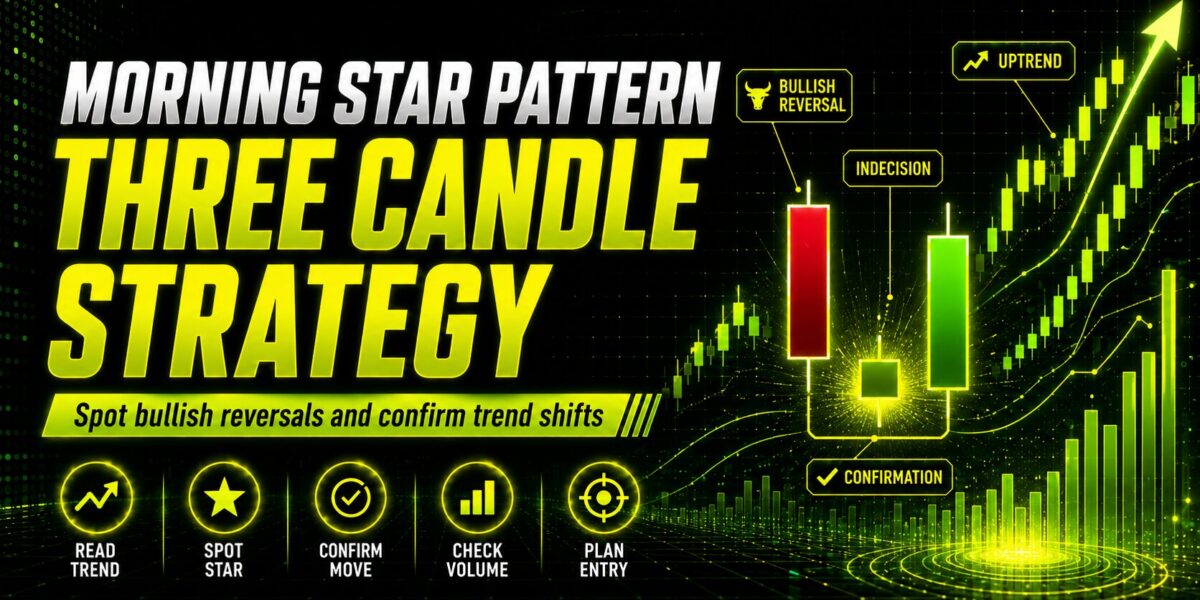
To successfully trade the morning star candlestick pattern, one must first master its structural anatomy. This multi-candlestick formation is comprised of three distinct candles that develop sequentially at the bottom of a downtrend, signaling that selling pressure is beginning to yield to buying control.
The First Candle: Confirming Bearish Dominance
The first candle of the pattern is a strong bearish candle that closes in the direction of the prevailing downtrend. This candle represents a period where sellers are in complete control, pushing prices lower and reinforcing the existing bearish market sentiment. The body of this candle is typically long, indicating that bearish momentum is strong and that market participants expect further declines.
The Second Candle: The Indecision Candle and Momentum Slows
The second candle is the focal point of the morning star pattern, often referred to as an indecision candle. It is a small-bodied candle that gaps down from the close of the first candle. The fact that the body is small—regardless of whether it closes as a bullish candle or a bearish candle—indicates that the downward momentum is slowing down. This candle represents a state of market hesitation and selling exhaustion, where aggressive selling pressure is met with an equal amount of buying interest, stabilizing the price. In a Three Candle Strategy, this second candle plays a key role in identifying a possible shift in momentum. The Three Candle Strategy helps traders understand when sellers are losing control and buyers may begin stepping in. By reading this indecision phase carefully, the Three Candle Strategy can support more accurate reversal confirmation and smarter trade planning.
The Third Candle: The Bullish Close and Buyer Commitment
The third candle is a strong bullish candle that completes the three-candle pattern. This candle must open near or above the close of the second candle and rally significantly, closing well above the midpoint of the first candle. A strong bullish close on this third candle serves as a definitive pattern confirmation, proving that buyers have stepped in aggressively and taken control of the short-term direction.
2. Market Psychology and Sentiment Change
Behind every candlestick pattern lies a story of human emotion, institutional positioning, and shifting market psychology. The morning star pattern is a visual representation of a rapid and decisive sentiment change among market participants.
| Phase | Candle Structure | Market Psychology | Sentiment State |
| Phase 1 | Strong Bearish Candle | Panic selling, short-sellers dominating, fear-driven capitulation | High Bearish Dominance |
| Phase 2 | Small-Bodied Candle | Selling exhaustion, profit-taking, early buyer participation | Market Hesitation & Stabilization |
| Phase 3 | Strong Bullish Candle | Aggressive buying, short-covering, momentum reversal | Rising Bullish Interest |
From Bearish Dominance to Market Hesitation
During a prolonged downtrend, the market is ruled by fear and bearish dominance. The first candle of the morning star pattern represents the climax of this selling pressure, where late-stage shorts are piling in and retail traders are capitulating. However, when the second candle gaps down but fails to make significant downward progress, the market psychology shifts. The small-bodied candle indicates that the aggressive sellers are running out of inventory, and buyers are beginning to absorb the remaining supply. This creates a state of stabilization and market hesitation. In a Three Candle Strategy, this phase helps traders identify when bearish pressure is weakening. The Three Candle Strategy also shows how buyer interest gradually builds before confirmation appears. By understanding this transition, the Three Candle Strategy can help traders make more disciplined and confident reversal decisions.
The Catalyst of Sentiment Change
The transition from the second to the third candle represents a massive sentiment change. As the third candle begins to rise, short-sellers realize that the market has failed to push lower despite the initial gap down. To protect their capital, these short-sellers begin to cover their positions by buying back the asset. Simultaneously, sideline buyers recognize the selling exhaustion and enter the market with aggressive buy orders. This combination of short-covering and new buyer commitment drives the price rapidly upward, establishing a clear reversal signal.
3. The Role of Volume and Confirmation in the Three Candle Strategy
While the visual structure of the morning star pattern is highly informative, relying solely on price action can lead to false signals. To increase the probability of a successful trade, technical analysts look for participation cues, particularly through trading volume and pattern confirmation.
Analyzing Trading Volume Patterns
Trading volume serves as a powerful validation tool in candlestick analysis. When analyzing a morning star pattern, the distribution of volume across the three candles is critical:
- First Candle: High trading volume on the strong bearish candle confirms that the downtrend is active and widely participated in.
- Second Candle: Low volume on the small-bodied candle suggests that the selling pressure is drying up, confirming selling exhaustion. Conversely, an unusually high volume on a very small-bodied second candle indicates a massive “churning” of orders, where institutional buyers are quietly absorbing all available supply, which strengthens the reversal signal.
- Third Candle: Rising volume on the third bullish candle provides clear confirmation of buyer commitment, indicating that the potential recovery is backed by institutional capital rather than retail speculation.
Pattern Confirmation and Follow-Through
A disciplined Three Candle Strategy requires waiting for the third candle to close before executing a trade. Entering prematurely during the formation of the second or third candle exposes traders to unexpected volatility and false breakouts. True pattern confirmation is achieved when the third candle secures a strong bullish close above the midpoint of the first candle. Furthermore, traders often look for follow-through in the subsequent sessions, such as sustained higher closes, to validate that a structural trend reversal has indeed commenced. The Three Candle Strategy also helps traders avoid emotional entries by focusing on confirmed price action, clearer market structure, and stronger buyer commitment. When applied with volume analysis and support levels, the Three Candle Strategy can improve trade timing, risk control, and overall decision-making accuracy.
4. Timeframe Relevance and Reversal Zones
The reliability and significance of a morning star pattern are heavily influenced by the timeframe on which it is observed and its location relative to key structural reversal zones on Trading Charts.
Timeframe Relevance: Daily vs. Short Timeframes
In technical analysis, timeframe relevance is a crucial concept. Patterns observed on a daily chart or a weekly chart carry significantly more weight than those found on short timeframes, such as the 5-minute or 15-minute charts. This is because shorter timeframes are filled with market noise—random price fluctuations driven by minor order flows rather than structural shifts in sentiment. A morning star pattern on a daily chart represents a major macroeconomic stabilization, making it a far more reliable reversal signal for long-term trading patterns. The Three Candle Strategy becomes stronger when applied to higher timeframes with clearer confirmation. Traders using the Three Candle Strategy should prioritize daily or weekly setups over noisy intraday signals. When combined with volume and support zones, the Three Candle Strategy can offer more dependable reversal insights.
Identifying Key Reversal Zones and Support Levels
A morning star pattern does not exist in a vacuum; its predictive power is magnified when it forms within established reversal zones. Traders should look for this pattern forming at:
- Major Support Levels: Prior price areas where buying interest has historically halted a price decline.
- Oversold Conditions: Technical indicators such as the Relative Strength Index (RSI) indicating that the asset is deeply oversold (e.g., RSI below 30).
- Fibonacci Retracement Levels: Significant retracement zones (such as the 50% or 61.8% levels) after extended declines.
When a morning star pattern forms at the intersection of these technical markers, the confluence of indicators dramatically increases the probability of a successful trend reversal.
5. Morning Star vs. Bullish Engulfing Pattern
To deepen one’s understanding of candlestick analysis, it is helpful to compare the morning star pattern with other prominent reversal formations, such as the bullish engulfing pattern.
Structural Differences
The primary difference between these two patterns is their candle count. The bullish engulfing pattern is a two-candle pattern where a larger bullish candle completely engulfs the real body of the preceding bearish candle. In contrast, the morning star is a three-candle pattern that incorporates an intermediate indecision candle between the bearish and bullish phases. This intermediate candle provides a distinct buffer period, allowing the market to transition from selling dominance to stabilization before the buyers launch their counteroffensive.
Psychological Nuances
From a market psychology perspective, the bullish engulfing pattern represents an immediate, aggressive rejection of lower prices. It is a sudden, violent shift in control. The morning star pattern, however, represents a more gradual, systematic transition. The presence of the small-bodied second candle shows that the bearish momentum slows down first, allowing sellers to exhaust their energy before buyers step in. The Three Candle Strategy helps traders read this transition with greater clarity and patience. For many conservative traders, this gradual stabilization makes the morning star a more mathematically robust and psychologically comfortable signal to trade. By using the Three Candle Strategy, traders can avoid impulsive entries and wait for stronger confirmation. A well-applied Three Candle Strategy supports better timing, improved risk control, and more confident reversal trading decisions.
6. Strategic Execution and Risk Management
No trading pattern is foolproof. In the financial markets, we operate in an environment of uncertainty, making probabilistic trading and strict risk management the cornerstones of long-term success.
Implementing Risk Management and Position Sizing
When executing the three-candle strategy, protecting your capital must always come first. Traders must calculate their position sizing based on the distance between their entry point and their stop-loss level. A common rule of thumb is to risk no more than 1% to 2% of your total trading capital on any single trade. By maintaining disciplined position sizing, you ensure that a string of false signals or unexpected market gaps will not severely damage your account.
Setting Stop Loss and Take Profit Targets
The structural geometry of the morning star pattern provides clear, objective levels for placing orders:
- Entry Point: Enter a long position immediately after the third candle closes, or wait for a minor pullback to the midpoint of the third candle for a more favorable risk-to-reward ratio.
- Stop Loss: Place your Stop Loss order just below the lowest wick of the second (indecision) candle. If the price breaks below this level, it invalidates the pattern, indicating that the bearish trend is continuing.
- Take Profit: Set your Take Profit target at the next major resistance level or use a fixed risk-to-reward ratio (e.g., 1:2 or 1:3).
Leveraging Instant Prop Funding Firms for Capital Scaling
For skilled traders who have mastered the morning star pattern but lack the capital to generate substantial income, partnering with an instant prop funding firm presents an exceptional opportunity. An instant prop funding firm provides qualified traders with access to funded accounts, allowing them to trade larger positions using institutional capital. Because these firms enforce strict risk management rules, trading within their ecosystem reinforces disciplined execution, ensuring that traders consistently apply proper position sizing and stop-loss protocols while capitalizing on high-probability reversal signals on their Trading Charts.